
Guus Dorenbos
Read all my blogsFor many years’ organizations try to get a feeling with their markets and want to know how satisfied customers are with the products or services they offers. The traditional way is to ask the customers for their opinions by inviting them to participate in a customer satisfaction survey. Traditionally these surveys consist of many questions and takes quite some time for the respondents to complete and have relatively low response rates.

In 2003 the Net Promotor Score (NPS) was introduced (Reichfeld, 2003). By providing a score from 0-10 to the question:
“Would you recommend us to your colleagues or friends”
The NPS is calculated. Depending on the score a customer’s falls in one of three categories.
The NPS is calculated by distracting the distractors % from the promotors %. So for example, when 20% of the respondents are promotors and 15% of the respondents are detractors, the NPS is 5.
Various factors impact the NPS such as brand awareness but also cultural differences. Over the years the NPS as an indicator for customer loyalty is criticised in various researches. Nevertheless, judging on my e-mail inbox, the NPS method is widely in use.
The Customer Effort Score (CES) is, according to several studies, considered to be a more reliable predictive indicator for increased business. Like the NPS method, the CES also has one question for example
“The organization ensured that my complaint was handled with low effort from me”.
The answer is a score from “I strongly disagree”, with value 1 to “I strongly agree” with values 5. The advantage is that with the CES you measure a specific process and customer behaviour whereas the NPS is a measure for the entire organization and measures just intentions and not actions.

Nevertheless, the NPS is easy to understand for everyone in the entire organization from the boardroom to the workfloor and is an acceptable indicator for growth but the CES is of more value in that respect.
C4C Configuration
If you want to engage with customers and increase customer loyalty, SAP Hybris Cloud for Customer can support your organization. To gather NPS or CES scores in C4C and to be able to report on the results, the following steps are described here. A key question to answer is where in the customer journey you would like to send a NPS survey to your customers. This could be periodically in the form of an e-mail campaign, or this is triggered by a specific transaction i.e. the completion of a service ticket.
Example
A customer has contacted the organization with a question or complaint. This interaction is logged in C4C as a Service Ticket. When the question is answered and the complaint is solved, the ticket is set to the status Completed. This is the trigger for sending an e-mail that contains a hyperlink to the SAP C4C Survey. When the survey is completed and submitted, the results are received in C4C and are available for reporting. To make this scenario work the following steps have to be done.
Prerequisite: Enhanced Sales Campaign Functionalities is added to the project scope to enable the use of Satisfaction Surveys.
Setting up the survey
Create a survey of Category “Satisfaction”. The survey question type should be “Multiple Choice (select one)”. Preferably, we would like to use the Matrix question type so that we get the answers in a horizontal presentation. For matrix type questions, however, we cannot assign an answer category. The standard C4C report makes use of the answer categories and these answer categories are required to determine the NPS score.
Create the NPS question “Would you recommend our company to a friend or colleague?” and assign the answer options. For each answer an Answer category must be assigned. The answer categories are pre-determined in the Survey finetune activity. Change the default colours to match your corporate identity and provide a URL to the company logo.


Save the created survey and note down the id of the survey (in this example 87). The result should look something like this;

Create an e-mail template:
Create the HTML e-mail template in a html editor of your choice and copy the following text. (Make sure you use the correct placeholder (in this case #SURVEY87#) and save the template. When you create your own e-mail template, make sure you use the C4C placeholders as defined in the workflow rule.

Create a workflow rule:
Create a workflow rule with rule type E-mail. In this case the e-mail is send when the ticket status is set to completed. Add the placeholders. These placeholders can be used in the e-mail template for personalization.
It is important to use #SURVEYID# (In this example #SURVEY87#) as a placeholder and map it to any field (for example External ID). When you’re done, upload the E-mail HTML template that you previously created. Finally, set the determination (to who the e-mail is to be send).

When the workflow is active and a service ticket is set to completed, the workflow triggers the sending of an e-mail that contains the hyperlink to the C4C survey. This is a continuous process so the NPS score is updated after each survey submission. To give management real time insight in the NPS we can make use of a (standard) report).
Reports and KPI’s
Based on the report key figure a KPI is used. Both the report and the KPI are standard available in C4C. The C4C report you need is “Business Partner Survey: Net Promoter Score”. The Net Promotor Score Key Figure is used in the corresponding KPI. You can add this tile to the homepage for specific business roles (hint: the KPI tile is actually a scorecard).
The downside with this standard C4C KPI is that you can not adapt the KPI. Instead I created my own KPI based on the same report and key figure. The advantage is that I can set a target for the KPI and use thresholds.

Clicking on the C4C standard KPI shows the related report. If the NPS score falls below -30 the KPI is in the red zone. All NPS values within the range of -30 and 1 are in the orange zone and all values higher than 1 are in the green zone.
All three indicators (NPS, CES and CSAT) have there merits so why not combine a NPS and CES or even CSAT questions in one survey? By creating a report that captures the CES and CSAT values from respondents you can create a KPI the same way as for the NPS.
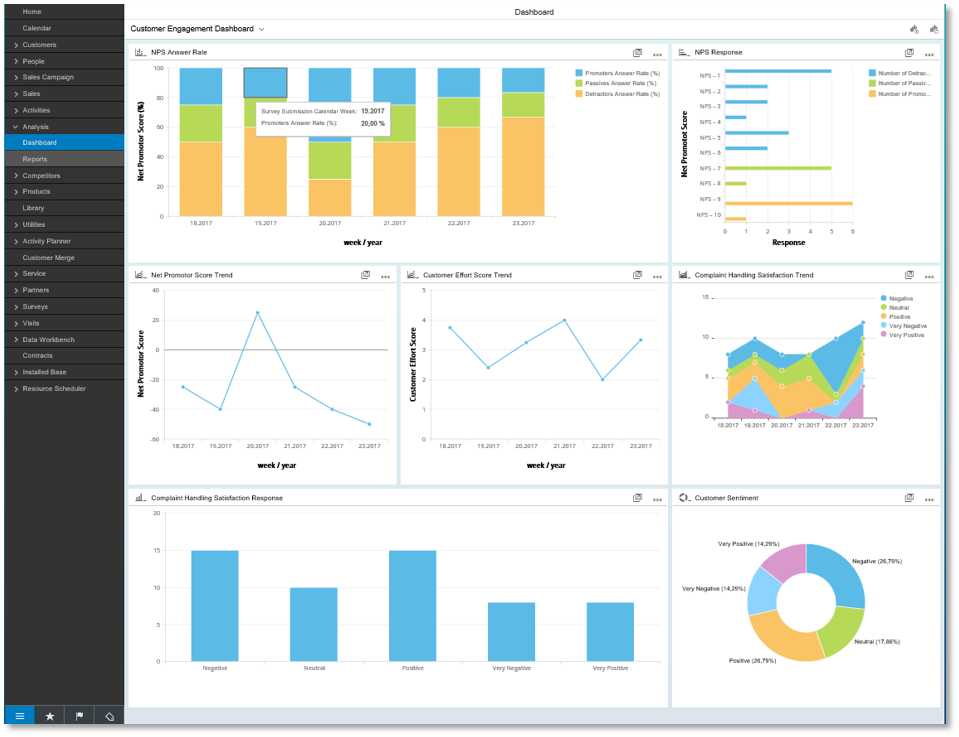
When a respondent answers all three questions we capture the scores in C4C and the results are real time available directly from you home screen. With the captured information I have created a couple of reports that can all be viewed from a Dashboard I created for this purpose.
From the dashboard, management has real time insight in the NPS and CSAT score, Trends and sentiment, all in one user friendly and interactive overview. The measuring of customer loyalty ads greatly to serving the right customers and improving your customer relations.
By getting customer responses in the form of a NPS score we have found a way to capture the organization value for the customer. By combining the value of the customer i.e. gross margin or sales turnover, we can make a start with a customer value segmentation.
In our blog of next week I will explore this path to see how we can manage this customer stratification concept in SAP Hybris Cloud for Customer.

Receive our weekly blog by email?
Subscribe here:


