Pieter Breunesse
Read all my blogsAt this moment there are two versions of the ABAP debugger, the old debugger and the new debugger available as of SAP Net Weaver 2004. With the new debugger, the functionality of the ABAP Debugger has increased tremendously.
Every now and then someone surprises me with functionality that I didn’t know was available. That’s the reason that I’m writing this blog so that I can share some of the findings within the debugger that made my life easier.
1. External breakpoints using Terminal ID;
2. Saving function module parameters;
3. Configure table layout with the table tool.
1. External breakpoints using Terminal ID
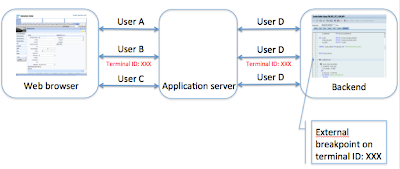
With external breakpoints using terminal ID we are able to debug a specific RFC or HTTP request from a user, without interrupting other request. This will be very handy when we have a situation where the frontend user differs from the user doing the RFC calls in the backend. Especially when the user is switched to a generic user, we want to be able to debug a specific request.
So instead of using an external breakpoint on username where all users will be interrupted we will use the terminal ID. The picture below will show the result when using the terminal ID on user B.
We can see that although the user switched to a generic user, the terminal ID on the request keeps its original value.
Step 1
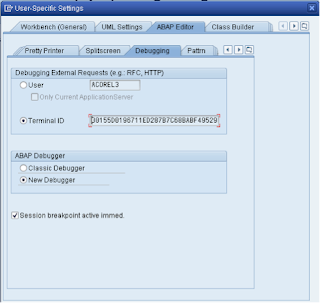
Switch on the terminal ID in the backend, go to:
Utilities ==> Settings ==> tab ABAP editor ==> sub tab Debugging
And select the radio button labeled Terminal ID.
The terminal ID shown will be used as an identifier for the external breakpoints that will be set. This ID is read from the windows registry.
Step 2
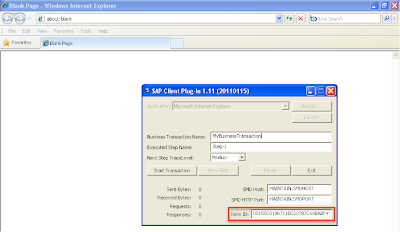
Set the terminal ID in the browser. To do so we need to use a browser plug-in, this can be found en downloaded from SAP note 1041556.
When downloaded we can execute the file which will launch a browser and an additional popup.
Here we can set the terminal ID that will be send from the browser. This needs to match the terminal ID shown in step 1.
After this we can start the process we want to debug in the browser and the debugger will be triggered when the breakpoint is reached and the ID’s match.
Additional info:
To set the terminal ID from a SAP gui use the transaction /hset tid=[terminal id]. This will overwrite the implicit terminal ID read from the windows registry.
2. Saving function module parameters
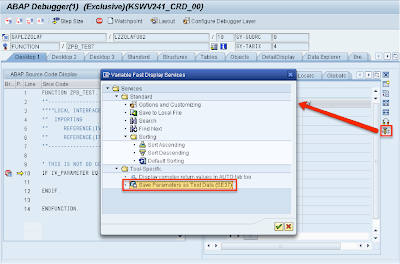
Well in some cases we want analyze a function module from transaction SE37, but the importing parameters are so complex that it takes a lot of time to enter this data manually. Well in some cases this you don’t need to do this, because you can save the parameters from the debugger.
Place a breakpoint within the function module that you want to execute from transaction SE37. When the breakpoint is reached and the debugger is active you will be able to select services of the tool (tab Desktop 1).
3. Configure table layout with the table tool
As of NetWeaver7.0 EhP2 the table tool within the new debugger has been improved. While you are in the debugger you are able to manipulate and change the contents. We will adjust the layout for a simple table with multiple lines, containing the same object.
So first we will go into the debugger and show the table with the default table layout.
Now imagine these were all different objects, with different content and we want to look at the data attributes within one of these objects. Clicking through the different objects and structures is time-consuming. The picture below illustrates the complexity for just displaying some data.
With the enhanced table tool we are able to click on the Columns tool as displayed below.
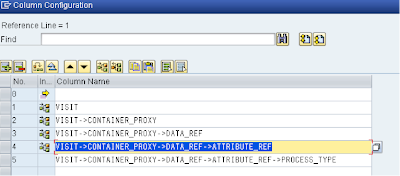
When clicked a pop-up screen appears where all columns are shown. In this case there is not much to show, there we only have one column. But if we had a very complex and extended table structure, we could remove, insert and sort the different columns quick and easy.
In this case we are interested in attributes of the object. Click on the icon before the column name and a new popup appears where we are able to mark the objects we want to see. And after confirming these will be added as a column in the table view.
After adding all necessary fields for us to show, the table view within the debugger looks like this.






One response to “ABAP debugger Tips & Tricks”
nice!