
Bianca Koene
Read all my blogs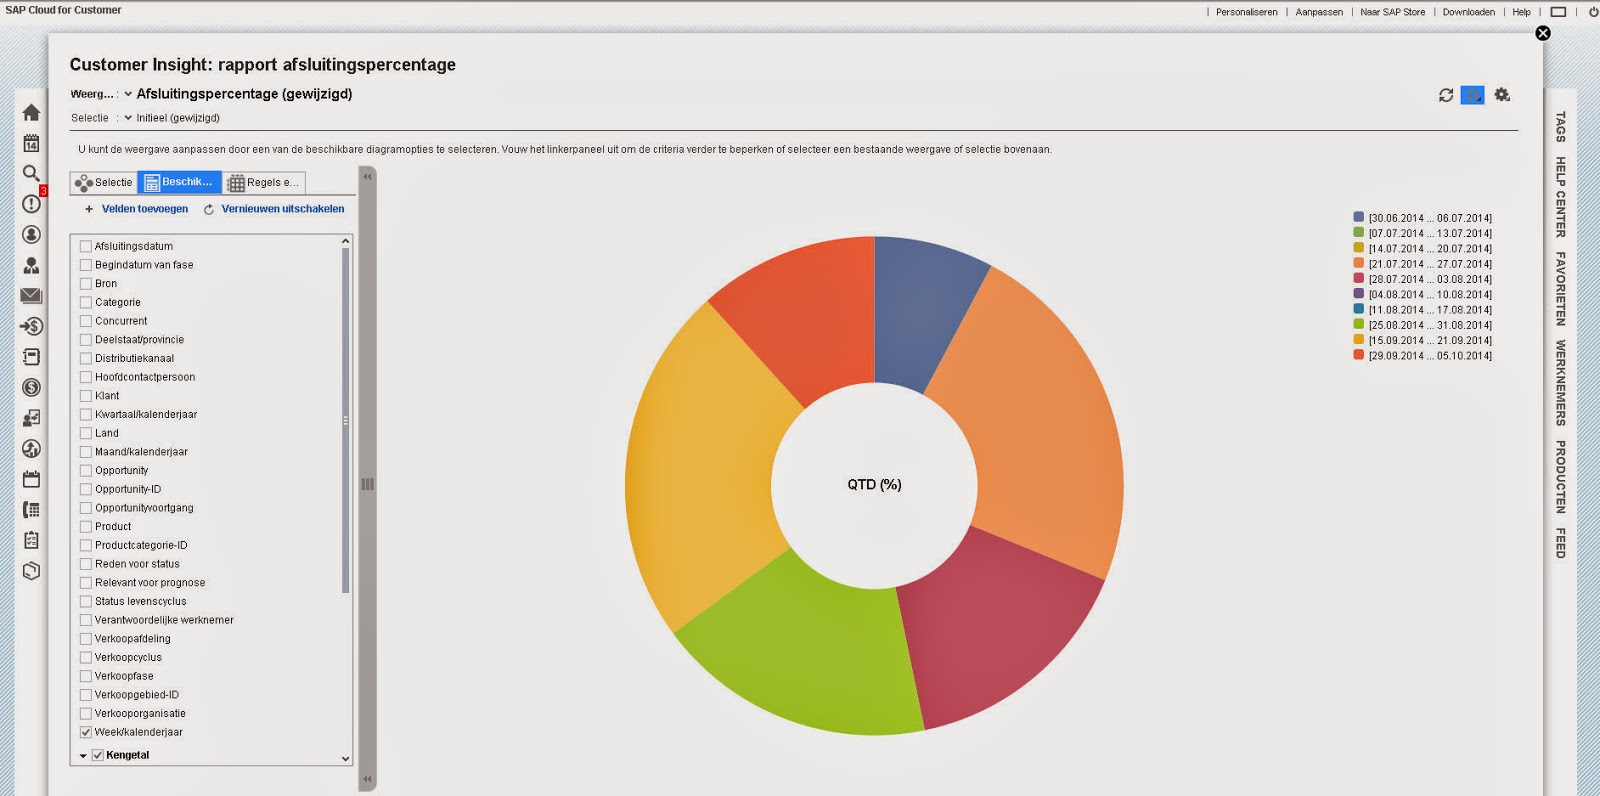 One of the most impressive functionalities of Cloud for Customer (C4C) is the reporting and analysis functionality. ‘Out of the box’ there are many reports and KPIs in C4C that are standard available. These standard reports can be adjusted and new reports can be built by C4C users if they are authorised for the work center ‘Business Analytics’. In this blog I will explain how to adjust a standard report. Also I will illustrate how to easily export a custom built report from the test tenant to the production tenant.
Customising a standard report
Let’s say you have added extension fields to the account details in C4C and you would like to make these fields available in your account reports. How do you do that?
Adding a Key User Tool field to a cloud datasource
First thing you do is making each account specific extension field available for reporting. This can be done by choosing ‘Edit Master Layout’ in the C4C menu.

Next you hover your mouse over the extension field and you choose ‘change properties’ –> ‘field definition’:

In the field definition, in the reporting tab, you decide to which datasource you would like to add this extension field. When later building a report based on this datasource, you can then also make this field available to the report. In the underneath example we are assigning an extension field to the datasource ‘Account Master Data’. After this we can adjust an Account Report (or create a new report based on this datasource) and make sure this field becomes available in that specific report.

Enrich a standard report with the Key User Tool field
Now that we have made the Key User Tool field available for the datasource Account Master Data we can next extend a standard report with this field.
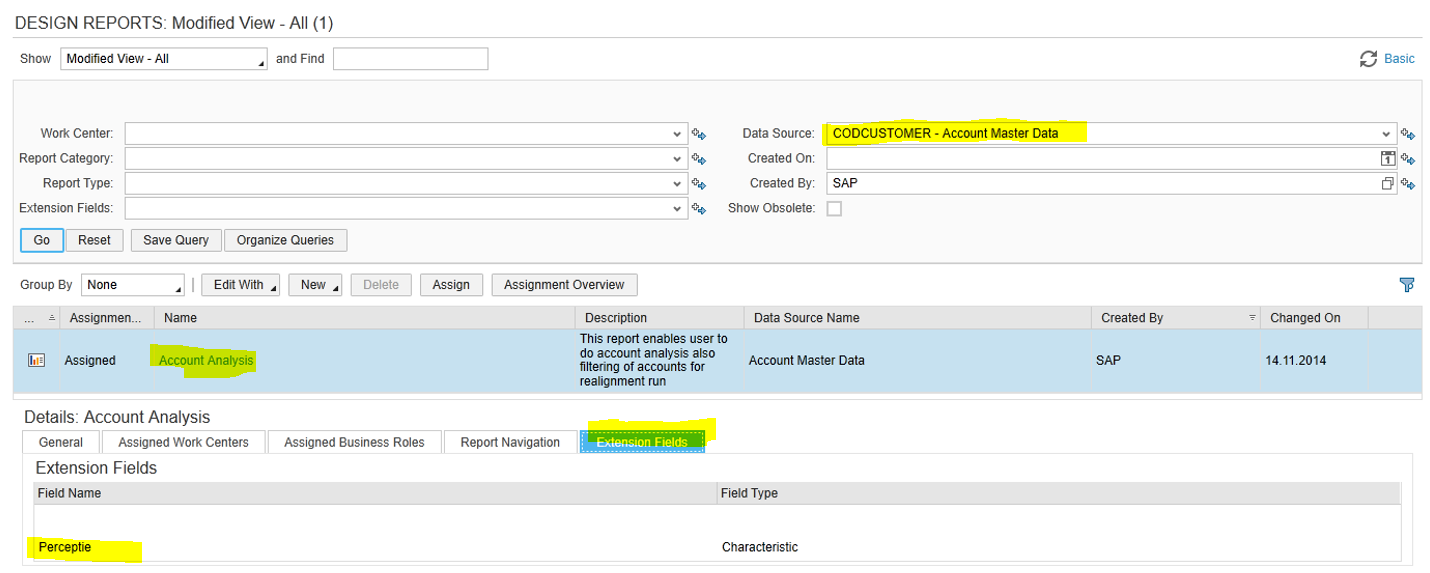
For this you need to be authorised to the workcenter ‘Business Analytics’ which can currently only be opened from Silverlight. SAP offers the standard report ‘Customer Analysis’ which is based on the datasource Account Master Data. Let’s extend this report with this field.
Choose to edit the report with the Webbrowser:

When you next click on ‘Add Fields’ you will see the dimension ‘Extension Field’. Here you will find all extension fields that you have added to the datasource ‘Account Master Data’, so also the field ‘perception’ that we have added in a previous step:


You can choose to only ‘display’ this field in the report. You can also choose to display this field in the selection area of the report. Initially the field appears in the section ‘Not currently shown’ of the report, but from here you can move the fields to the rows or columns of the report.


Exporting and importing custom built reports
Reports can easily be exported from the test tenant to the production tenant. However in that case you have to have created your own report based on an existing datasource or for example a joined datasource. In the above example I have added the extension field to an existing SAP report. That I cannot export to the production tenant. So in order to be able to export and import a customised report, I should have created a new report based on an existing datasource.
For downloading a custom built report you go, in Silverlight, to Business Analytics -> Upload/ Download. You can download Dashboards, Data Sources, Key Figures, KPIs and Reports. If you decide to download a report, it also includes underlying datasources, keyfigures and KPIs for example.

In the test tenant you choose to Download your report. In the below example I download a report for which I have created a join between the datasource for visits and employees.

By downloading the report, I thus also download the underlying joined datasource and key figures.

By choosing to download, an XML file is created that you need to save to your computer.
In the production tenant you can then choose to Upload the Downloaded report (XML file).

That’s all! Happy Reporting!

Receive our weekly blog by email?
Subscribe here:


2 responses to “How to customise a standard report in C4C”
Hi,
I am new to C4C. I did not see "Edit Master Layout" in my C4C page.
Also i have "ANALYSIS" tab but not "Business Analytics" tab.
Also can i create reports and KPI other than the default ones or only customization of the defaults are possible.
Hi,
Please make sure you change to Silverlight via menu options Adapt -> Launch in Microsoft Silverlight. From the Business Analytics facet you can create your own KPIs, Key Figures, Datasources, Reports and Dashboards. This is not possible from HTML5.