
Roderick Stoffels
Read all my blogsSince a couple of years the utilities industry has been going through a massive transformation process. One of the reasons is the increasing importance of renewable energy, which is turning the entire market model completely upside down. Companies need to revise their business processes and think about ways of introducing new products to compensate for shrinking margins in their traditional business. The last couple of years I have been working on several assignments for companies within the utilities line of business. Although these companies have their own set of work methods and processes, each time they had the need or a request for a standard report.
The requirement for this standard report is to have an overview of the service tickets registered containing all relevant premise details and SLA time recordings for each service ticket. A fairly reasonable report request considering the activities within this line of business. Unfortunately the data to set up this report is not available within one data source. This blog will discuss how to set up this report.

Data sources
As mentioned in the introduction, the data to fulfil the requirements for this report is not available in one data source. In fact, we need three SAP data sources to join with each other. The data sources needed are the following:
- CRMSRQHB – containing all tickets;
- CODUTLPREMISE – providing an overview of utility premise and related tickets;
- SEODSRQDTS01 – containing ticket data of main contact party, various time points, process.
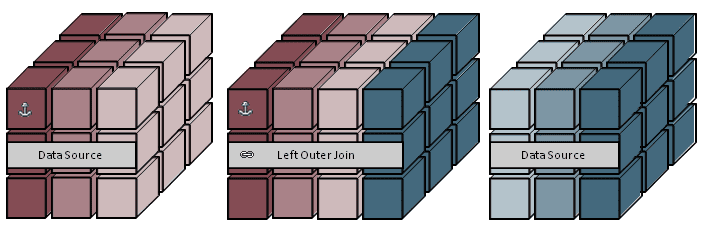
By joining these three data sources, the result will be one data source containing all the relevant information and data to create the report.
Although the mutual field ‘Ticket-ID’ is available in all three data sources, I did not manage to join these data sources in one step. So, it became a two-segment approach.
Step 1 – Join CRMSRQHB with CODUTLPREMISE;
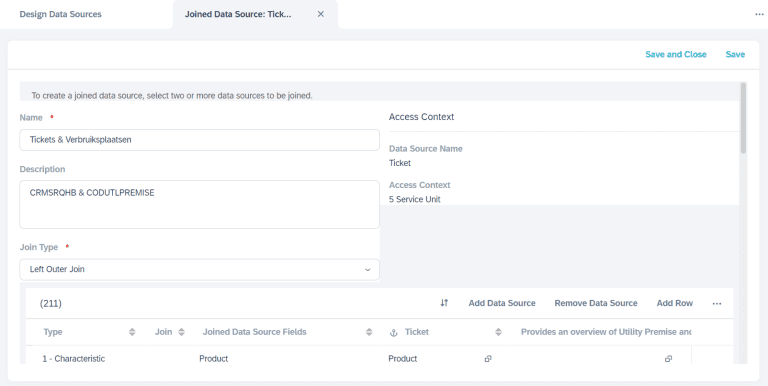
The result of this first step is that you can collect all the relevant premise details (i.e. address details of the premise, details about the installation point) belonging to the registered service tickets. The next step (see below) is to join this newly created data source with the data source that contains all the time recordings and contact parties regarding service tickets.
Tip: Make sure to delete all unnecessary links between mutual fields. SAP will automatically link mutual fields from both data sources in the joined data source. In this case it is only necessary to keep the link for the field ‘Ticket-ID’ between both data sources.
Step 2 – Join data source SEODSRQDTS01 with the joined data source (CRMSRQHB with CODUTLPREMISE);
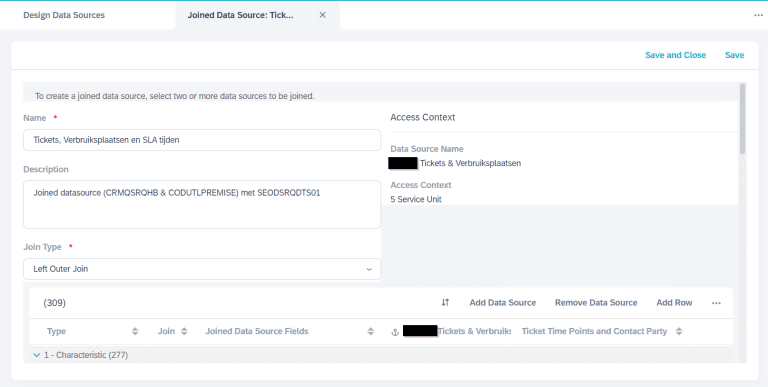
The result of this second step is that you can collect all the relevant time recordings (i.e. initial review due date, escalation date, etcetera) belonging to the registered service tickets. It is also possible to collect the data about the different contact parties of the ticket, like the processor or the reporter of the ticket.
Tips:
– Again, make sure to delete all unnecessary links between fields. SAP will automatically link similar named fields from both data sources in the joined data source. Only keep the link for the field Ticket-ID.
– If there are certain fields that need to be renamed, you would better rename them in the joined data source instead of renaming them in the different reports to be created. In this way you have to rename the field only once instead of renaming the fields for every new report to be created, i.e. ‘Created on’ rename into ‘Date of registration’.
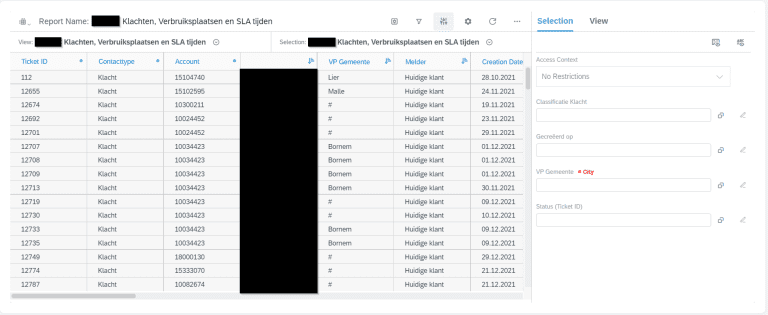
Create report
Now that the joined data source containing all relevant data and information about the service tickets has been created, the final step is to create the desired report with all the necessary fields for the business to gain their insights. It is also very useful to add some filter options to the report. During my latest assignment, the customer wanted to be able to see how many service tickets were registered per city. So, I have added the field ‘City’ as a filter or selection option among some other fields.
Finally
In case of joining multiple data sources, make sure that you have joined these data sources in the right way! Otherwise you will be spending a lot of time setting up the reports before representing the correct data.
But also for performance reasons. If the data sources are not joined correctly, the performance of the system will be impacted. Further tips can be read in a former blog from my colleague Daan Schattenberg.
Once the data sources are correctly joined, you can go wild on reporting!

Receive our weekly blog by email?
Subscribe here:

